
Procurement organizations have become a performance driver for the enterprise. Once viewed primarily as a support function, procurement now sits at the center of competitive advantage: cost management, risk mitigation, supplier optimization, decarbonization, and more.
To address these challenges and refine their strategies, procurement teams need to track 13 key performance indicators. Here’s your guide.
Table of Contents:
Cost Reduction and Control
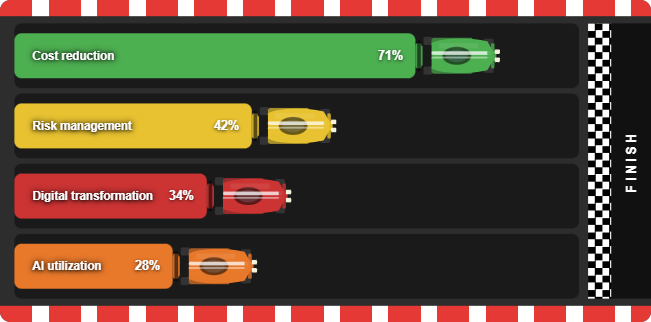
Persistent inflation, geopolitical tensions, rising tariffs, and market volatility have made cost reduction the top procurement priority for the fourth consecutive year in 2025.
In this environment, implementing and monitoring cost control KPIs has become essential.
#1 Maverick Spend Rate
This indicator measures the proportion of purchases that bypass established processes within your organization (ordering, approval, validation). Often unpredictable and invisible, these purchases generate unmanaged costs. Industry estimates suggest they account for roughly one-third of total spending.
While direct procurement typically follows well-defined procedures, indirect procurement management, less strategic and more occasional, is frequently overlooked.
This represents an untapped opportunity for savings that can be addressed through e-procurement solutions and platforms such as Amazon Business.
Formula :(Purchases bypassing established processes / Total purchases) × 100
#2 Contract Compliance Rate
This indicator evaluates your organization’s contract discipline: the ability of teams to direct purchases toward contracted suppliers at negotiated terms.
When purchases deviate from existing contracts, it may signal poor visibility into agreements, misalignment between negotiated contracts and operational needs, or non-compliance with procurement policy.
Regular monitoring identifies categories where contract compliance remains weak and enables corrective actions: renegotiation, enhanced communication, or supplier panel adjustments.
Formula : (Purchases made with contracted suppliers / Total company purchases) × 100
#3 Competitive Sourcing Rate
This third cost control KPI measures the share of strategic purchases processed through formal competitive supplier selection.
Through a well-structured sourcing process, procurement organizations can negotiate more favorable pricing and reduce spend.
Recent years have proven this approach particularly decisive. In a context of high and persistent inflation, competitive sourcing has enabled many organizations to contain price increases, rebalance negotiating power, and in some cases generate savings despite market pressure.
Formula : (Purchases subject to competitive sourcing / Total company purchases) × 100
Productivity Improvement
Procurement organizations now operate across diverse and often resource-constrained areas, making productivity tracking through KPIs essential to ensure process efficiency, optimize costs, and maximize business value.
#4 Internal Customer Satisfaction Rate
Essential for evaluating service quality delivered by the procurement organization, this indicator measures how well internal teams feel their needs are understood, handled efficiently, and met.
Typically calculated through satisfaction surveys, it helps identify process pain points that need improvement (response times too long, lack of visibility, complex procedures).
High satisfaction levels reflect smooth collaboration between procurement and other departments and directly contribute to overall company efficiency. Conversely, a decline in this indicator may reveal operational dysfunction, communication gaps, or the need to evolve certain processes.
Formula : (Number of positive responses (e.g., Very Satisfied and Satisfied) / Total number of responses) × 100
#5 Supplier Onboarding Time
Supplier onboarding is a critical step that determines successful commercial relationships and helps prevent fraud, errors, and regulatory non-compliance. During this period, several categories of information must be collected:
- Supplier identification: name, company registration number, legal form, contact details, etc.
- Organizational structure: shareholders, management identities, group affiliations, etc.
- Track record: reliability, stability, operational capabilities, and reputation
- Quality of products and services provided
- Payment terms
Tracking this metric, which measures the time required to onboard a new supplier, helps balance two imperatives: moving fast enough to avoid operational delays while taking sufficient time to validate information and mitigate the risks mentioned above.
Formula : Final validation date – Supplier record creation date
#6 Number of Purchase Orders Per Buyer
Digitalizing procurement processes primarily aims to improve operational team efficiency. In this context, tracking the number of purchase orders per buyer is an important indicator. It measures the administrative workload each team member handles, identifies overly manual processes, and quantifies the real impact of deployed tools.
Regular observation of this volume and the nature of orders processed helps identify optimization levers: automation of certain steps, controlled delegation, improved purchase requests, redesigned approval workflows.
This analysis also enables teams to quantify time freed up through digitalization and reallocate it to higher-value activities such as supplier management, negotiation, or spend analysis.
Formula : Total number of purchase orders / Number of buyers
#7 Average Purchase Order Processing Time
Execution speed represents a major challenge for the procurement function. An overly long process can delay supply, disrupt production, generate additional costs, or unnecessarily tie up internal teams.
Conversely, smooth order processing strengthens employee satisfaction, improves business continuity, and contributes to spend control.
Regular monitoring of average purchase order processing time quickly identifies friction points: excessive approvals, incomplete data, lack of standardization, or delays caused by manual tasks.
Formula : Order issue date – Purchase request creation date
Supplier Relationship Management
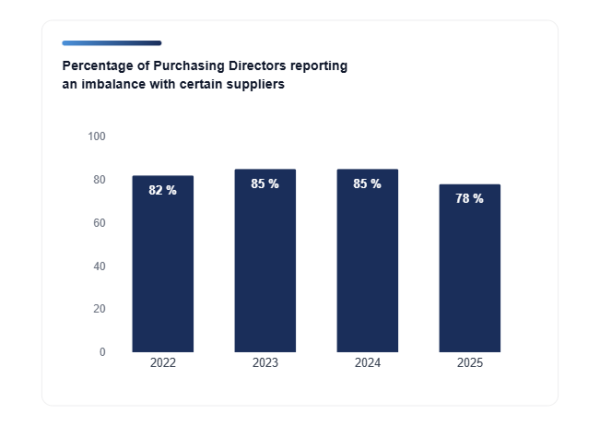
The geopolitical and economic disruptions we’ve experienced have created sustained pressure on supply chains, sometimes generating imbalances in customer-supplier relationships. Even though this pressure appears less acute today, procurement organizations remain confronted with a central challenge: ensuring the reliability of their partner networks.
In this context, organizations have no choice but to strengthen their supplier focus and become, as much as possible, their “preferred customer.” This requires relationships built on trust, transparency, and continuous dialogue, but also rigorous monitoring through several indicators.
#8 Late Delivery Rate
This indicator measures the proportion of deliveries made beyond agreed timelines relative to contractual commitments. It serves as a major benchmark for evaluating a supplier’s operational reliability and ability to meet expected service levels.
A high late delivery rate directly weakens the value chain: operational disruptions, schedule adjustments, logistics cost overruns, and internal user dissatisfaction. It also serves as a warning signal potentially revealing structural supplier difficulties: capacity constraints, logistics disruptions, quality issues, or poor demand visibility.
To restore a healthy relationship and strengthen collaboration transparency, opening structured dialogue with affected partners is essential. This approach enables precise identification of failure root causes and joint definition of necessary corrective actions.
When gaps become recurring or compromise business continuity, contract renegotiation may be required: service level revisions or, when justified, formalization of late delivery penalties. A clarified framework helps secure supply and sustainably rebalance supplier relationships.
Formula : (Number of late deliveries / Total number of deliveries) × 100
#9 Non-Conforming Order Rate
Non-conforming orders from suppliers can trigger particularly damaging chain reactions for the organization.
When a delivered product or service doesn’t match what was ordered, whether in quantity, quality, or specifications, the company first incurs an obvious financial loss: the value received no longer aligns with the expense incurred.
Beyond economic impact, non-conformance directly affects team productivity. Insufficient quantity or unsuitable equipment can block production, delay internal projects, or disrupt daily employee operations. Each gap generates a hidden but real cost for the company.
It also complicates accounting processes. Automated three-way matching between purchase order, receipt, and invoice relies on perfect data consistency. As soon as an anomaly appears, the flow must be handled manually: gap analysis, supplier exchanges, internal adjustments… All operations that slow the process and mechanically extend payment timelines.
To prevent these issues, regular monitoring of the non-conforming order rate is essential. A downward trend reflects a healthy and controlled supplier relationship. Rising rates should instead trigger in-depth analysis to identify gap origins and implement appropriate corrective actions.
Formula : (Number of non-conforming deliveries / Total number of deliveries) × 100
#10 et #11 Dispute Rate and Resolution Time
As in any commercial relationship, friction points can emerge over time. Disputes most often originate in contractual misunderstandings, interpretation differences, communication errors, or recurring delivery delays.
When they accumulate, these incidents weaken relationships and can ultimately lead to legal proceedings or even contract termination.
Hence the importance of closely monitoring the number of open disputes and their evolution over time. A supplier may show a dispute volume significantly above average, indicating structural difficulties or an unbalanced collaboration. Absent a rapid resolution, it may be necessary to consider recourse to an alternative supplier to preserve business continuity and limit organizational impact.
The ideal approach remains intervening at the first signals. Implementing corrective measures, clarifying expectations, or adjusting the contractual framework often enables defusing tensions before they escalate.
Short resolution time reflects a healthy relationship and effective dialogue. Conversely, lengthy or laborious processing increases the risk of lasting deterioration.
Dispute Rate Formula: (Number of open disputes / Total number of orders or invoices) × 100
Resolution Time Formula: Sum of resolution durations for each dispute / Number of resolved disputes
#12 Supplier Dependency Rate
Risks facing your suppliers can weaken their ability to ensure service continuity. It therefore becomes crucial to evaluate the dependency level your organization maintains with each of them, to anticipate any failures.
This analysis typically relies on spend analysis by supplier and procurement category cross-referenced with risk criticality levels.
It enables identifying partners where excessive dependency could represent a major risk, and anticipating actions to implement: panel diversification, volume revisions, competitive sourcing, or enhanced operational monitoring.
Formula : Annual amount purchased from supplier / Supplier revenue × 100
Environmental Criteria Compliance
Integrating sustainable development objectives has become a strategic priority for procurement organizations, to comply with various regulations (duty of care, CSRD, CS3D, Omnibus), reduce environmental impact, strengthen supply chain resilience, and meet growing stakeholder expectations (customers, investors, employees).
This means companies must go beyond periodic audits and proactively evaluate their own practices as well as those of their partners.
#13 CO₂ Consumption and Savings Calculation
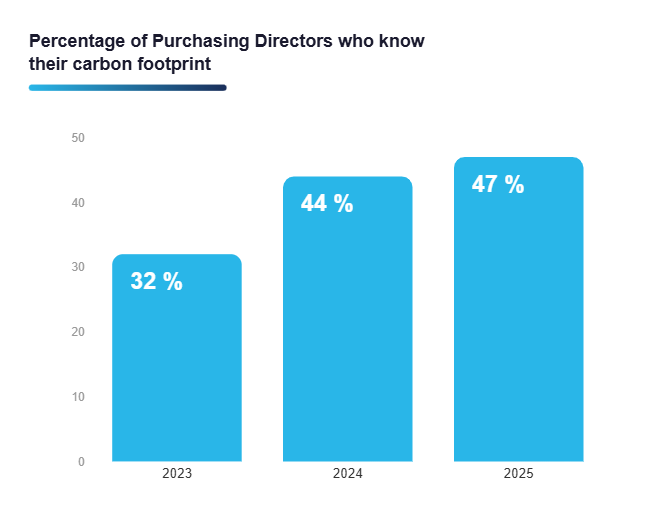
85% of procurement organizations make decarbonization one of their top priorities.
This starts with measuring the carbon footprint of their purchases. Categorized as “Scope 3” emissions, they represent 75% of total CO₂ emitted by the enterprise, according to CDP (Carbon Disclosure Project).
Tracking the evolution of these emissions over time is essential to verify whether strategic directions (responsible purchasing, low-carbon partnerships, new consumption models) effectively reduce the organization’s overall footprint.
So-called Scope 4 emissions, which measure avoided emissions through more sustainable alternative solutions, complement this analysis and provide a more granular view of environmental performance.
Scope 3 Emissions Formula: Sum (Volume purchased × Unit emission factor)
How AI and Procurement Tools Help Track Your KPIs
Procurement KPI monitoring cannot be limited to a periodic exercise. To deliver real value, analysis must be part of a continuous and proactive approach, enabling teams to track the evolution of actions taken, measure their effects, and adjust processes over time.
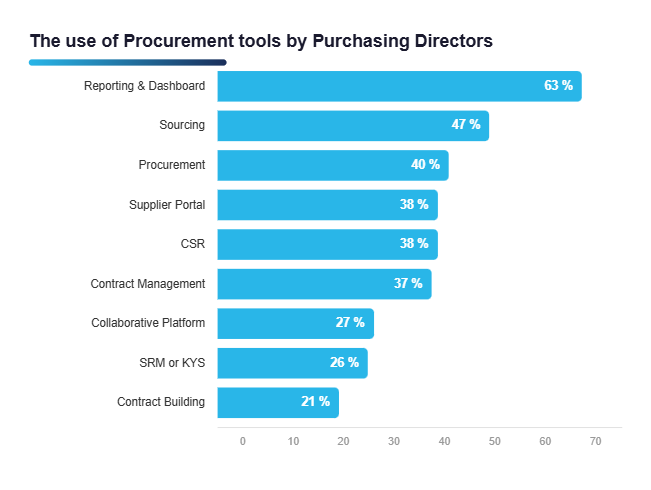
In this perspective, Source-to-Pay solutions provide valuable support. Their integrated reporting and dynamic dashboards offer procurement organizations a centralized, reliable, and current view of their indicators. These are among the most widely used capabilities, precisely because they facilitate decision-making.
AI now extends these capabilities by delivering analysis and automation levels previously inaccessible. It enables notably:
- Data collection and processing automation: algorithms aggregate large volumes of information from multiple sources in real time, consolidate and structure them. This automation limits human error and ensures continuous dashboard updates.
- Predictive analytics and intelligent recommendations: through machine learning, tools identify trends, anticipate risks, and suggest corrective actions. They can, for example, propose optimization scenarios or recommend alternative suppliers.
- Anomaly and fraud detection: AI automatically flags transaction inconsistencies: unjustified price variations, non-compliant suppliers, atypical behaviors. These alerts strengthen internal control and secure spending.
Let’s Discuss Your Project
If you want to structure your performance management and adopt tools capable of automating your KPI analysis, our experts can guide you and help you take the next step in procurement digitalization.